How to Read Instagram Analytics: A Practical Guide for Creators & Brands
November 20, 2026
 TheFameNest Growth Desk· Instagram Growth Editor
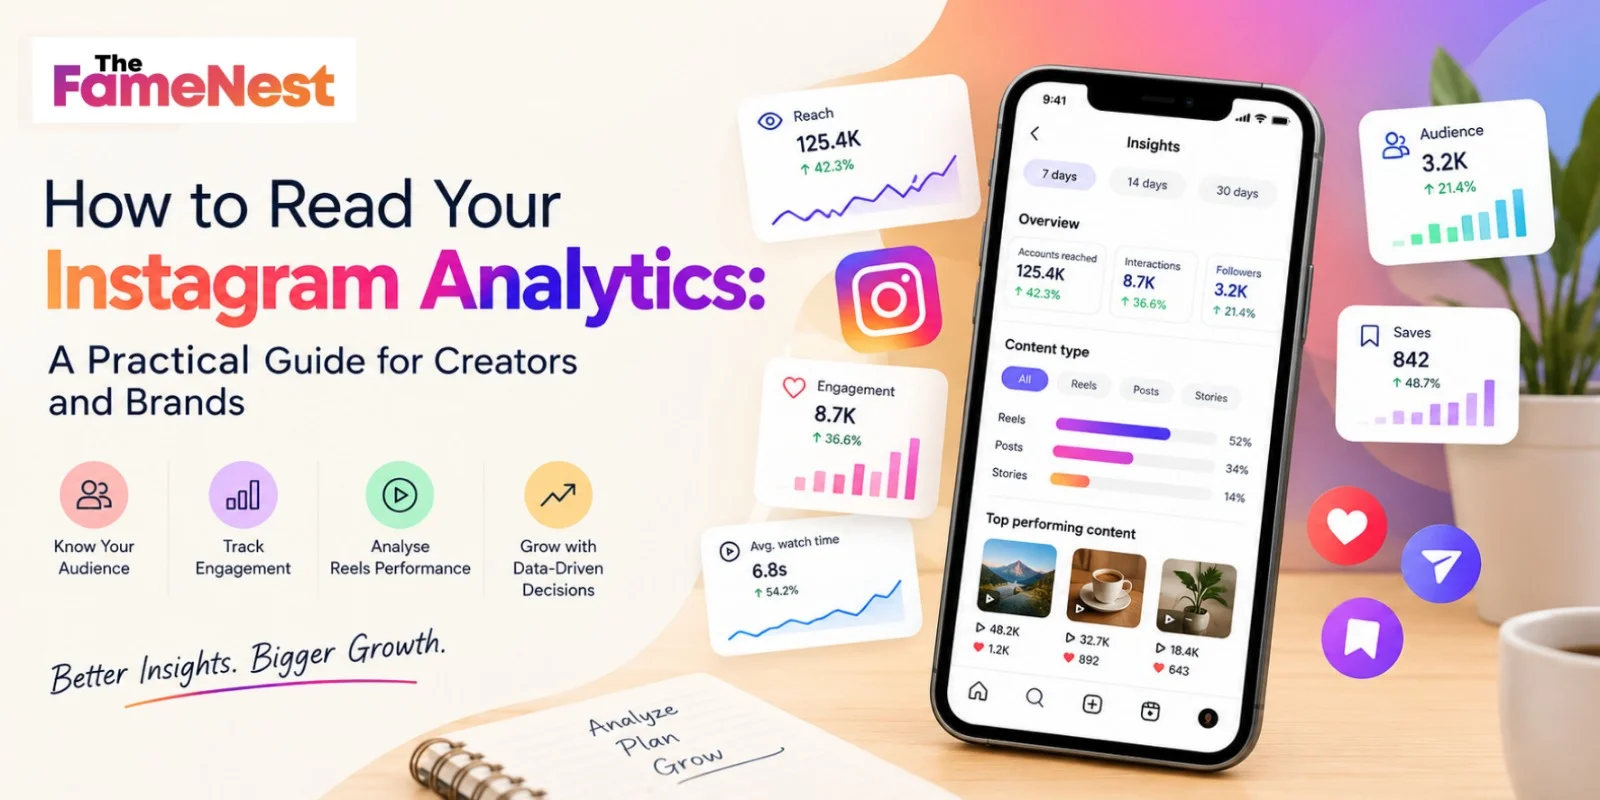
How to Read Your Instagram Analytics:
A Practical Guide for Creators and Brands
A café owner told us she posted every day for two months and "nothing worked." When we opened her dashboard, the answer was sitting in plain sight. Her Reels reached thousands of people, but almost nobody watched past the first two seconds. Her photos reached fewer people but got saved constantly. She had the data. She just didn't know which numbers to trust.
This guide walks through the metrics that matter, what they actually tell you, and what to do next.
Where to find your analytics
Switch to a Professional account (Creator or Business), then open your profile and tap Professional dashboard to see Insights. You can view results by time period and by content type. Instagram updates its dashboard and metric names from time to time, so labels may differ slightly from what you see here.
The four questions your analytics answer
1. Who saw it? (reach and views)
2. Did they care? (interactions, saves, shares)
3. Who are they? (audience data)
4. Did it grow anything? (follower change and profile actions)
Ignore any metric that doesn't help you answer one of these.
Metrics explained
| Metric | What it tells you | What it doesn't tell you |
| Accounts reached | How many unique accounts saw your content | Whether they paid attention |
| Views | How often your content was displayed or played | How many separate people saw it |
| Likes | Quick approval | Lasting interest |
| Comments | Active conversation | Whether the sentiment was positive |
| Saves | The content was useful enough to keep | Whether people acted on it |
| Shares | People wanted others to see it | Who they sent it to |
| Average watch time (Reels) | How long people stayed | Why they left |
| Profile visits and follows | Whether content turned curiosity into interest | Which post exactly caused it |
Saves and shares are usually the strongest signals of real value. Likes are the least informative and easiest to offer.
How to read your Reels
Reels give you the most useful diagnostic data:
• Average watch time vs. video length: If a 30-second Reel averages 6 seconds, your opening is the problem.
• Retention curve: Look for the exact moment viewers drop off. Cut or tighten whatever happens right before it.
• Followers vs. non-followers: A Reel that mostly reached non-followers is working as a discovery tool. One that mostly reached followers is working as a loyalty tool. Both are useful.
A 20-minute weekly routine
1. Minutes 1 to 5: Check reach and views for the last 7 days against the previous 7.
2. Minutes 6 to 10: Sort your last 10 posts by saves and shares, not likes.
3. Minutes 11 to 15: Open your best and worst performing Reel and compare their first three seconds.
4. Minutes 16 to 20: Write down one thing to repeat and one thing to stop.
Keep a simple note with those weekly findings. After a month, you'll see patterns that no single dashboard screen shows.
What to check by account type :
| Account type | Most important metrics | Common mistake |
| Personal brand | Profile visits, follows per post | Judging success by likes alone |
| Small creator | Watch time, shares | Posting more instead of improving openings |
| Local business | Profile actions (calls, directions, link taps) | Chasing reach from people far away |
| Online shop | Link taps, saves on product posts | Ignoring which posts drive visits |
| Agency | Trends per client over 30 to 90 days | Comparing clients' raw numbers to each other |
Audience data: who you're really talking to
Check age, location, gender split, and active times. If your audience is mostly in a different time zone, your posting schedule may be working against you. If your location data doesn't match your business, your content may be attracting the wrong crowd.
Common mistakes
• Reading one post as a trend. Look at 5 to 10 posts before changing strategy.
• Comparing reach across formats. Reels, carousels, and Stories behave differently.
• Chasing the highest number. A post with 500 saves is often worth more than one with 5,000 views and none.
• Checking too early. Wait at least 48 hours for a post's numbers to settle.
• Ignoring context. A holiday, a trend, or a collaboration can distort one week's results.
Red flags worth investigating
• Reach declines over a few consecutive weeks. Review your recent formats, posting times, and any change in content style.
• Strong views but flat follower growth. Your content entertains, but your bio and profile may not give people a reason to follow.
• High follower count, very low reach. Your audience may be inactive or not interested in your niche anymore.
• Engagement concentrated on a single post. You may have one hit but no repeatable formula yet.
Turn numbers into decisions
Analytics are only helpful if they influence your next course of action. After each weekly review, pick one adjustment: a stronger hook, a different posting time, a new format, or a follow-up post on your best-performing topic. Test it for two weeks, then check the numbers again. Over time, you'll replace guesswork with a clear picture of what your audience wants
TheFameNest Growth Desk
Editorial team at TheFameNest — practical notes on Instagram followers, likes, comments, pacing, and account-safe social proof for creators and brands.